From monitoring the health of the world's vegetation to mapping regions struck by natural disasters and supporting urban planning, the Copernicus Sentinel-2 satellites are key to observing and understanding our planet.
Check out facts to learn more about this incredible mission.
The Earth in our sights
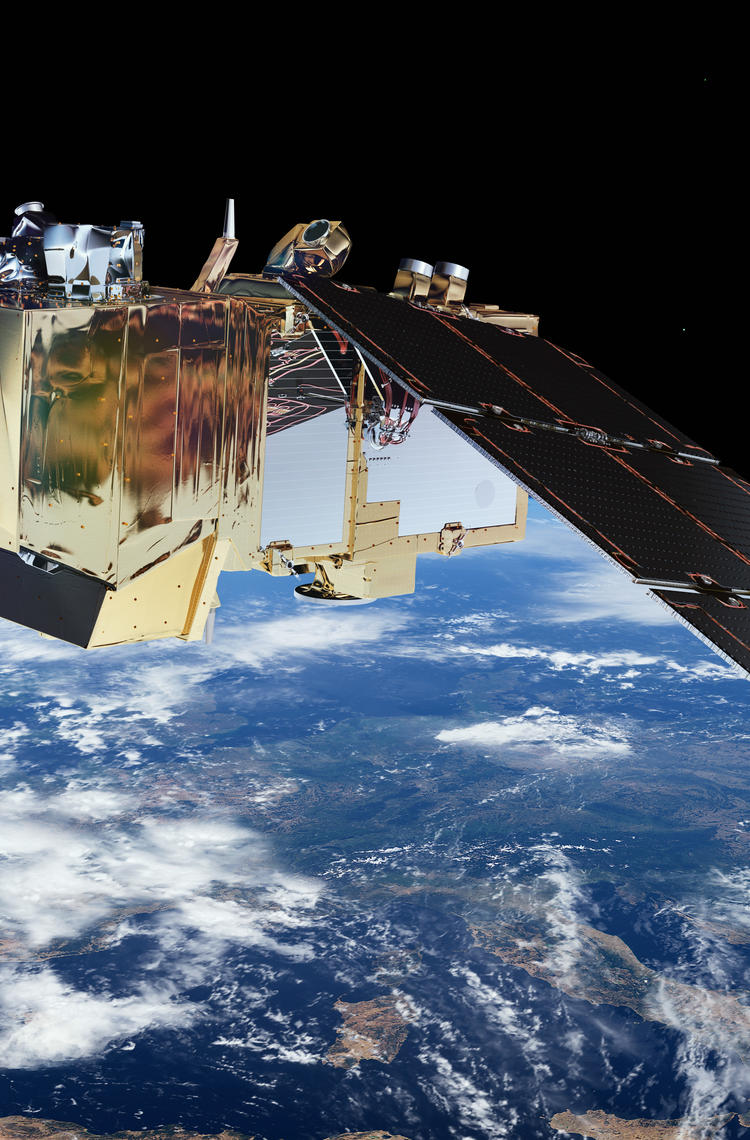
The Sentinel-2 satellites capture images of all of Earth’s major land surfaces, coastal areas and inland waters every five days. The twin satellites fly in the same orbit but separated by 180° to each other and have a wide field of view (or swath width) of 290 km. They have dramatically improved our Earth observation capabilities.
© ESA
Capturing the unseen in many facets
Each Sentinel-2 satellite stands out for its Airbus-developed multispectral imager, that captures data across 13 different bands (wavelengths of light), allowing us to see and analyse some aspects on the Earth’s surface that are hidden from human view. Sentinel-2 is the first Earth observation mission of its kind to include three bands in the ‘red edge’, which provide key evidence on the state of vegetation.
Landscape around Venice in four different band combinations (layers)

© Copernicus - Sentinel Hub
A. The true colour visual shows natural colours that represents the Earth as humans would naturally see it.
B. The false colour is used to assess plant density and health, since plants reflect near infrared and green light, while they absorb red.
C. The NDVI layer allows us to quantify green vegetation. It is a measure of the state of vegetation health based on how plants reflect light at certain wavelengths.
D. The moisture index is used to determine vegetation water content and monitor droughts.
Zoom into detail
With every pixel in each delivered image ranging from 10 to 60 metres, the Sentinel-2 satellites provide detailed observation of landscapes, urban areas and vegetation and allow surprising discoveries like new penguin colonies!
A penguin colony near Cape Gates was captured in this image on 7 November 2016. Although penguins are too small to show up in satellite images, giant stains on the ice from penguin droppings – known as guano – are easy to identify at the 10 m pixel resolution. These brownish patches have allowed scientists to locate and track penguin populations across the entire continent.

Cape Gates Antarctica, Sentinel-2 © ESA
365 terabytes per year!
Since the launch of Sentinel-2A in 2015, the satellites have provided continuous Earth observation data. Over one terabyte of valuable data is produced every day, accessible to scientists, businesses and the public.
The Sentinel-2 mission is part of the Copernicus programme, composed of a fleet of innovative satellite missions - the Sentinels. The programme is led by the European Space Agency (ESA) and European Union (EU) and is designed and built by a consortium of about 60 companies led by Airbus.

© ESA
Continuity with Sentinel-2C
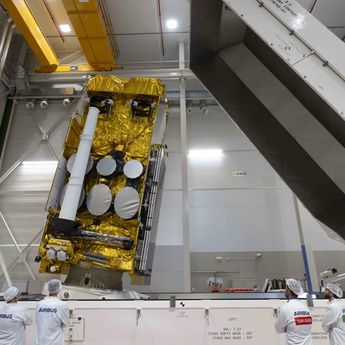
The Airbus-built Sentinel-2C is the third in this vital Earth observation family and will progressively replace Sentinel-2A which is set to retire in the coming months. It will carry on the legacy by continuing to provide similar types of data allowing to analyse areas changes over years and decades, instrumental for measurement methods.

Copernicus Sentinel-2C before loading into its container
Agricultural insights
Sentinel-2 can monitor the health of plants and help improve farming methods. Images from the satellite’s multispectral instrument can distinguish between different crop types and determine numerous plant indices such as leaf area index, leaf chlorophyll content and leaf water content.
Agricultural monitoring in Spain

© Contains modified Copernicus Sentinel data, processed by ESA
Disaster response
Sentinel-2 data supports rapid response during natural disasters, providing critical information for managing floods, wildfires and other emergencies. The rapid mapping provides information on the level of damage and the extent and impact for rescue services.
The image below shows severe flooding caused by the overflowing of the Indus River south of Kandhkot, a small town in Pakistan's Sindh province, leading to significant devastation.

© European Union, Copernicus Sentinel-2 imagery - August 2024 (source)
Helping tackle deforestation
Stung Treng province in Cambodia is known for its rich biodiversity and vast forests. In recent years, it has also become a hotspot for deforestation. These two images show the scale of the problem. The left image shows a region that is still largely forested (2018). In contrast, the right image (2024) shows significant areas where forests have been cleared, an indication of the rapid rate of deforestation - vital information for those fighting deforestation.

© European Union, Copernicus Sentinel-2 imagery - August 2024 (source)
Discover more Space news
Continue Reading

Airbus ships fourth European Service Module for Artemis IV
Press Release
Space
Fourth European Service Module (ESM-4) is ready to leave Airbus’ facilities in Bremen, Germany, and be shipped to NASA’s Kennedy Space Center, Florida, USA
Sentinel-1D: the radar that never sleeps
Web Story
Space

Airbus-built SpainSat NG-II secure communications satellite successfully launched
Press Release
Space

Airbus, Leonardo and Thales sign Memorandum of Understanding to create a leading…
Press Release
Company

Tracking air pollution from space
Web Story
Space
